M. A. Nwachokor1, Olaniran E. Aluko2
Abstract: This study was carried out to determine the spectral signature of the soils and other most common cover types under field conditions in Antequera, Southern Spain. Subsequently, the potential of this information as reference data for enhancing the utility of Remote Sensing Technology to achieve sustainable development of the predominantly agricultural area was evaluated.
A spectroradiometer (Exotech ERTS radiometer model 100) was used to measure the spectral reflectances of the different terrestrial target objects in accordance with standard procedure. The instrument had four bands which corresponded to the four bands of Landsat MSS in the wavelength range of 0.5 – 1.1μm. Results revealed that the cover types exhibited a distinctive spectral response pattern or spectral signature so that they could be distinguished from one another. Also, the measured reflectances correlated with those of Landsat MSS data, thus suggesting that the data could be used to calibrate airborne and satellite sensors. Clearly, therefore, the data presented a high potential to enhance the usefulness of remote sensing for inventorying, monitoring and management of the land resources to achieve a sustainable development of the sub-region.
Keywords: Antequera, Cover types, spectroradiometer, Spectral Signature, Soils, Southern Spain.
- INTRODUCTION:
Remote sensing systems, with fixed range of spectral sensitivity, have the capability to analyze different surfaces at wavelengths not detectable to the human visual system. This has been able to generate data that far exceeds the current capacity to handle these data and have been used over the years to distinguish between different features on the earth surface based on each characteristics spectral signature. Consequently, the observation of these earth features using bands 1 to 4 in the electromagnetic spectrum have provided a broad based platform for remote sensing the earth surface and has provided various applications in agriculture in general and specifically found usefulness in soil analysis and crop production.
In order to maximize the potential utility of Remote Sensing Technology for management of the resources of the earth for sustainable development, there is often a compelling need for reference data (ground truth) to serve any or all of the following purposes: to aid in the analysis and interpretation of remotely sensed data, calibrate a sensor, and/or to verify information extracted from remote sensing data (Lillesand et al., 2007).
One form of reference data that are often needed to verify or enhance the usefulness of Remote Sensing are the ground-based measurements made of the reflectance and/or emittance of surface features to determine their spectral response patterns under field conditions. Such measurements are also needed to calibrate sensors for the inventory, monitoring and management of the earth resources.
The objective of the present study is to determine the spectral response patterns (signatures) of soils and other most common cover types in the study area. These data will be used to evaluate and enhance the usefulness of Remote Sensing as a potential tool in the earth resources development of Antiquera, Malaga province of Southern Spain.
- STUDY AREA:
The study area is the city of Antiquera, in Malaga Province of Southern Spain which lies within latitudes 370 001 0411 and 370 101 0411 N and longitudes 40 51 1011 and 40 311 1011 W. It lies 47 km north of the city of Málaga and covers an area of 749.34 km2 with 41,854 inhabitants and population density of 55.85 inhabitants/km2.
The area is covered by the topographic map sheet of Antequera (No. 1023, Scale 1: 50,000) and is. Altitude ranges from 380m to 750m (above sea level).
- METHODOLOGY:
The following instruments were used during the field work:
- A spectroradiometer (Exotech ERTS radiometer model 100)
- A tripod or radiometer stand of 1m high
- Barium sulphate plate (as standard panel)
- Field computer (Sharp 1500) with SPECTRODATA program (written by Elbersen, G.W.W. and D.P. Shresta of Soils Division, ITC, Holland).
The spectral reflectance of soils and other cover types were measured with the spectroradiometer. The radiometer can measure the reflective flux of an object to a sensor within the wavelength range of 0.5 – 1.1μm in four different bands: 1, 2, 3 and 4. These bands correspond to those of Landsat MSS: green (0.5 – 0.6μm), red (0.6 – 0.7μm), near infrared (0.7 – 0.8μm) and near infrared (0.8 – 1.1μm).
Selected sample area was kept under the tripod on which the radiometer was fixed. Reflectances were measured for all bands, both for the sample area of the target surface and the standard panel with minimum time gap to prevent time-induced differences in the reflectance.
Care was exercised to ensure that the reflectance measurements were taken under an almost cloud-free condition. This was to minimize temporal differences during the observations.
The procedure outlined in Lillesand et al. (2007) for using a radiometer to measure spectral reflectance of target objects has been followed in this study. First, the radiometer was aimed at the standard panel, so as to ascertain or quantify the incoming radiation, or irradiance, incident upon the measurement site. Next, the instrument was suspended over the target cover type and the radiation reflected by the object was measured. Finally, the spectral reflectance of the target was computed by ratioing the reflected energy measured in each band. The data were then saved in, and printed from the field computer.
- RESULTS AND DISCUSSION:
The percentage reflectance of the soils and other cover types in the study area are shown in Table 1.
Table 1: Percentage (%) Reflectance of the various cover types
Cover Types | % Reflectance | |||
Wavelength (µm) | ||||
0.5-0.6 | 0.6-0.7 | 0.7-0.8 | 0.8-0.11 | |
Dark Soils | 3.00 | 6.00 | 14.50 | 17.00 |
Light Soils | 23.50 | 28.50 | 25.00 | 38.00 |
Soils with stony fragments | 14.00 | 27.00 | 37.00 | 43.00 |
Olive | 5.00 | 7.00 | 26.00 | 31.00 |
Grapes | 9.50 | 6.50 | 54.50 | 71.50 |
Sun flower | 7.50 | 10.50 | 54.50 | 67.50 |
Barley (ripen/yellow) | 14.00 | 17.50 | 34.00 | 41.00 |
Wheat | 12.50 | 18.00 | 29.50 | 50.50 |
Oats | 12.50 | 18.00 | 29.50 | 50.50 |
Maize | 7.50 | 6.00 | 54.50 | 71.50 |
Anise | 20.00 | 22.50 | 47.50 | 46.00 |
Potato | 3.00 | 10.00 | 60.00 | 51.00 |
Chick pea | 4.00 | 7.00 | 29.50 | 50.00 |
Grass | 4.50 | 5.00 | 14.50 | 20.50 |
Onion | 7.00 | 11.00 | 23.50 | 44.50 |
The dark soils had low reflectance in all bands compared to the light-colored soils (Figure 1). The dark soils low reflectance value maybe due to high organic matter content and probably the presence of iron oxide and the surface roughness of the soil particles (fine-medium size particles) which are sometimes smooth to touch. The soils with stone and petrocalcic fragments showed higher reflectance in red and infrared bands than the soils that had no fragments and this may due to its coarse nature which make them to be well drained, resulting in low moisture content. This is in agreement with the statement “Coarse textured dry soils will have more reflectance than fine textured soils’.
The use of Reflectance Spectroscopy to characterize and thoroughly sample variation within a target population of soils has been well documented (Stenberg et al., 1995).

Olives had low reflectance in both green and red bands, but high in the near infrared bands. This is because chlorophyll concentration has high reflectance value in infrared bands (0.7 – 1.1μm).
In the survey area, only a small part was covered by grapes and that was mainly on the hill and piedmont reliefs. Most of the surface of these land units was covered by bioclastic sandstones and petrocalcic fragments. The grapes in this area gave low reflectance in green and red bands and very high reflectance in NIR bands. This may be due to the surface conditions and also the amount of chlorophyll content.
Barley was ripen and therefore yellow, thereby giving a low reflectance value in green and red bands but high value in infrared bands.
Both wheat and oats were at the harvesting stage; they both showed the same, high reflectance in green and red bands and in NIR.
Tian (1989) had observed that often it could be especially difficult to distinguish between different types of vegetation as their spectral signatures can be so much alike. Furthermore, the same type of vegetation could have different signatures dependent on stage in growth season and on other factors, such as soil humidity or atmospheric conditions. Generally, however, vegetation has a unique spectral signature which enables it be distinguished readily from other types of land covers (Liew, 2001).
It was not easy to sample maize as it could not constitute the dominant object in the Field of View (FOV) at that mid stage of growth. However, its reflectance in the green and red bands was very much lower than in the infrared bands.
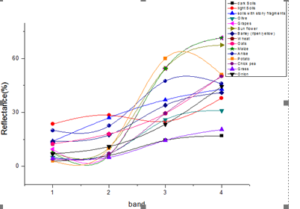
The spectral reflectance curves of the features are depicted in Figure 2. The reflectance properties of anise followed the normal vegetation curve in the green, red and infrared bands. Potato showed quite a high reflectance in NIR and comparatively very low in the green and red bands. The green vegetation (Sunflower, Olive) had low reflectance in green and red bands but showed quite high reflectance in NIR bands. Again, further distinction could be made between sunflower and olive probably due to difference in chlorophyll contents: sunflower gave higher reflectance in all bands than olive. Yellow or ripen crops like barley, wheat and oats gave higher reflectance values than the green vegetation (Olives and Sunflower) in the green and red bands.
On the whole, the following facts are important to note. Understanding the factors which influence the spectral response of the features of interest is critical to correctly interpreting the interaction of electromagnetic radiation with the surface (Staff.aub.edu.lb). Some environmental factors might influence the reflectance value that a radiometer can capture during measurement. They include variations in atmospheric conditions, wind velocity and sun angle. Measurements of radiant flux are being made after its transmission through a dynamic, turbulent, absorbing and scattering medium: the atmosphere. Therefore, any change in the atmospheric conditions is likely to result in a significant influence on the measurement of reflectance.
The higher the speed of the wind, the more scattering during the transmission and this will contribute to variation in reflectance of the object of interest. Measurement of reflectance also depends on the angle of irradiation flux and angle of radiation flux, which involves radiation geometry.
It has also been established that land use/cover classes may not be separable at a single point in time, but only when seen at different times in the growing season (Remote Sensing – eduspace; staff.aub.edu.lb). Therefore, multi-temporal classification is hereby recommended in order to maximize the usefulness of Remote Sensing Technology for the sustainable development of the earth’s resources of the study area.
Lastly, it should be emphasized that there is no substitute to ground-truthing whenever the need arises to confirm a finding or clarify a doubt in the application of remote sensing for resources inventory, monitoring and management (Lillesand et al., 2007).
- CONCLUSION:
The different soils and land cover types exhibited distinctive spectral response patterns and each has its own unique spectral signatures. The green vegetation that had more chlorophyll content exhibited higher reflectance in the NIR than those with less chlorophyll. Dark soils could be distinguished from light soils because the latter exhibited higher reflectance than the former in all the bands. The amount of coverage a feature presented in the field of view (FOV) had significant influence in its reflectance properties. Also, the stage of the growing season of the annual crops influenced the amount of reflectance exhibited. Hence, multi-temporal measurements are strongly recommended in order to enhance analyses, interpretations and predictions in the application of remote sensing technology for the inventory and management of the vegetation. Obviously, the data collected in this study could suitably be used to calibrate airborne and satellite sensors, thereby enhancing the utility of remote sensing for the sustainable development of the land resources of the Sub Region.
REFERENCES:
- Gibson P.J (2000) “Introductory Remote Sensing- Principles and Concepts” Routledge, London.
- Liew, S.C. (2001). Principles of Remote Sensing 01 Tutorial. Centre for Remote Imaging, Sensing and Processing (CRISP). Singapore.
- Nagesh Kumar D and Reshmidevi TV (2013). “Remote sensing applications in water resources” J. Indian Institute of Science, 93(2), 163-188.
- Short N.M (1999). “Remote Sensing Tutorial – Online Handbook”, Goddard Space Flight Center, NASA, USA.
- Stenberg, B.E., E. Nordkvist, and L. Salomonsson (1995). Use of near infrared reflectance spectral of soils for objective selection of samples. Soil Sci. 159: 109 – 114.
- Thomas Lillesand, Ralph W. Kiefer and Jonathan Chipman (2007). Remote Sensing and Image Interpretation. Wiley India.
- Tian, Guoliang (1989). Spectral Signatures and vegetation indices of crops. CSIRO, Institute of Natural Resources and Environment, Division of Water Resources, Canberra.
- D. Lichaa El-Khoury (2003). Use of Remote Sensing. In Natural Resouces Management.
- www.eduspace.esa.int
- www.lb.aub.edu.lb/../GIS course.html